Missouri’s 1st Congressional District Maps
A collection of interactive precinct-level maps exploring the 2024 election results and voter turnout across Missouri’s 1st Congressional District.
General Election (November 2024)
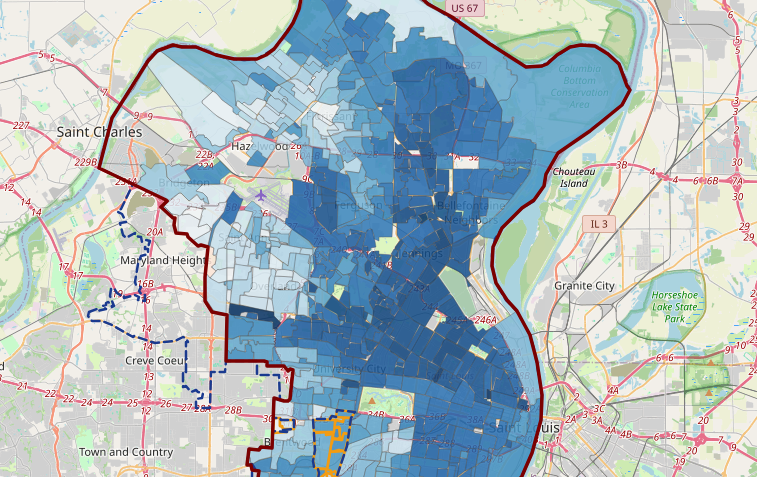
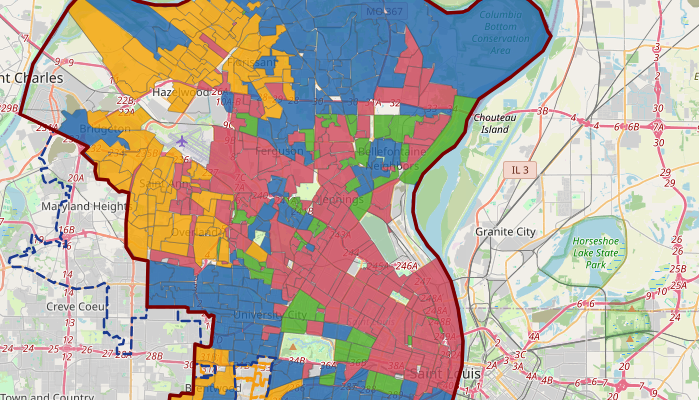
CD1 Presidential Results
- Data: 2024 Presidential results (Harris vs Trump) by precinct
- Colors: Blue=Harris, Red=Trump
- District view: Core CD1 precincts colored by margin; newly added precincts (from CD2) shown with gold border
- Context: Outside/removed precincts shown as grey
- Hover details: Candidate %, vote counts, and margin
View Map →
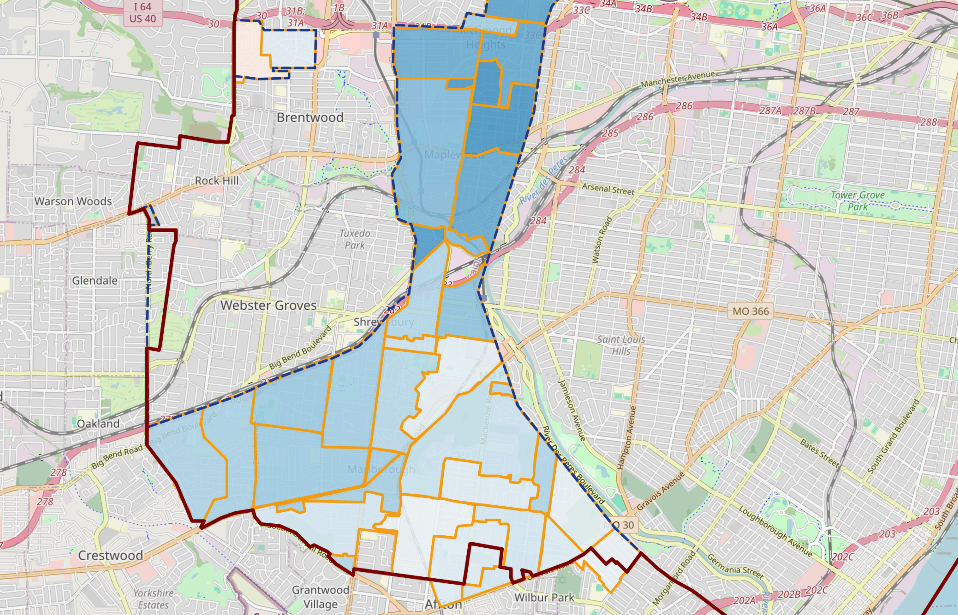
CD2 Race in CD1 Area The Map You Asked For
- Focus: CD2 race (Hartmann vs Wagner) in the 37 precincts moved from CD2 into new CD1
- Colors: Red=Wagner, Blue=Hartmann
- Context: All other precincts shown as grey only
- Purpose: Shows the political character of the newly added area
- Legend: Aggregate Hartmann/Wagner totals across the 37 moved precincts
View Map →
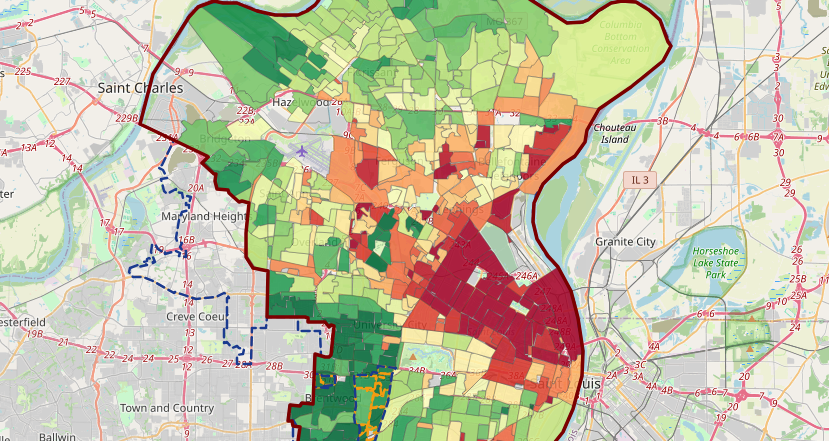
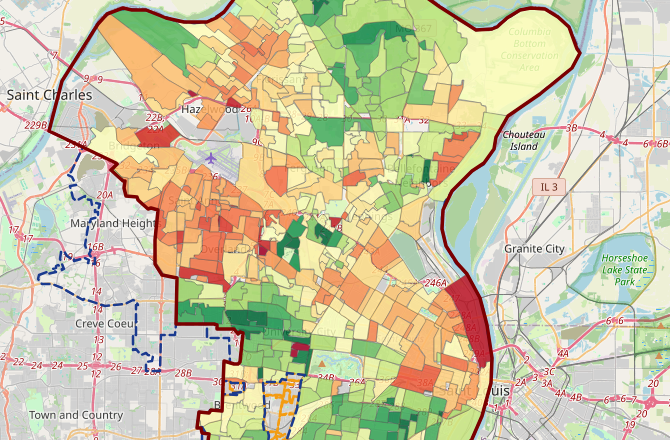
General Election Turnout
- Three toggle views:
- Raw % (YlGn gradient, 0–80%)
- vs. Average (CD1 avg: 64.2%)
- Below Average (purple intensity shows ballot deficit)
- Coverage: Both core and newly added precincts
View Map →
Primary (August 6, 2024)
CD1 Democratic Primary Results
- Data: Democratic Primary results (Bell vs Bush) by precinct
- Colors: Blue=Bell, Red=Bush
- Participation: Only core CD1 precincts held this primary
- Newly added precincts: Shown hatched grey (were in CD2, had no CD1 primary)
- Hover details: Bell/Bush %, vote counts, and margin
View Map →
Primary Turnout
- Three toggle views:
- Raw % (0–60%)
- vs. Average (primary avg: 26.7%)
- Below Average
- Newly added precincts: Shown grey (held no CD1 primary)
- Data suppression: Precincts with <10 registered voters shown as light grey
View Map →
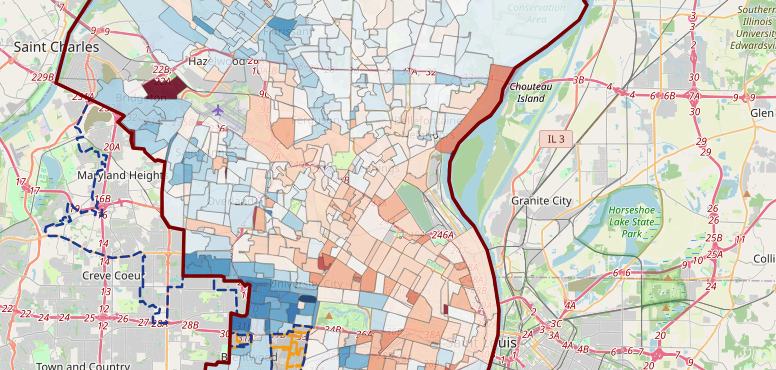
Compare: Primary vs General Turnout
Turnout Comparison
- Four analytical views:
- Gap: How much higher general turnout was than primary
- Primary/General Ratio: Share of general voters who also voted in primary
- Quadrant: Core engaged / General-only / Primary loyalists / Low engagement
- Filter panel: Explore by candidate vote share and precinct winner
View Map →